Dental patient communication has moved well beyond appointment reminders. Large practices and hospital-based dental teams…

Top Patient Experience Metrics Healthcare Providers Should Track
What your patients experience during their hospital visit doesn’t end when they leave. It follows them home, shapes what they tell others, and can even influence how well they recover. That’s why more and more healthcare providers are using patient experience as a key metric to measure how well they are performing.
Recent research backs this up. A study by JAMA Health Forum found that hospitals with stronger patient-experience scores also achieved better outcomes in safety, quality, and cost efficiency. Furthermore, Press Ganey notes that patients who felt safe during care were more than twice as likely to recommend their provider compared to those who didn’t.
This blog will walk you through the most important patient experience metrics you should be tracking. You’ll see what each one reveals about your organization’s overall health and how using these insights can help you strengthen outcomes, loyalty, and trust.
Why Measure Patient Experience in Healthcare?
This isn’t just about keeping patients happy. Their experiences in your clinic determine whether they get better, return, and whether you get paid. Here’s what happens when you track it:
- Better Health Outcomes: Communication breakdowns confuse patients about their health conditions and their next steps. Making them feel heard and answering their questions makes they follow their treatment plans.
- Building Trust and Loyalty: Patients return when they have good experiences. Otherwise, you’re just pushing them to find another provider. This gets worse since patients with bad experiences will also talk about it with their friends and family.
- Operational Efficiency: Patient experience metrics reveal problems that you can immediately fix to make your operations run smoother.
- Value-Based Care and Reimbursement: Payment models are changing. You don’t just get paid for seeing patients anymore; you get paid for quality. Patient satisfaction metrics are part of how that quality gets measured. Low scores mean less money. High scores mean bonuses.
- Competitive Advantage: Better patient satisfaction metrics make more money and keep more patients. If you’re not tracking this, your competitors are, and they’re winning.
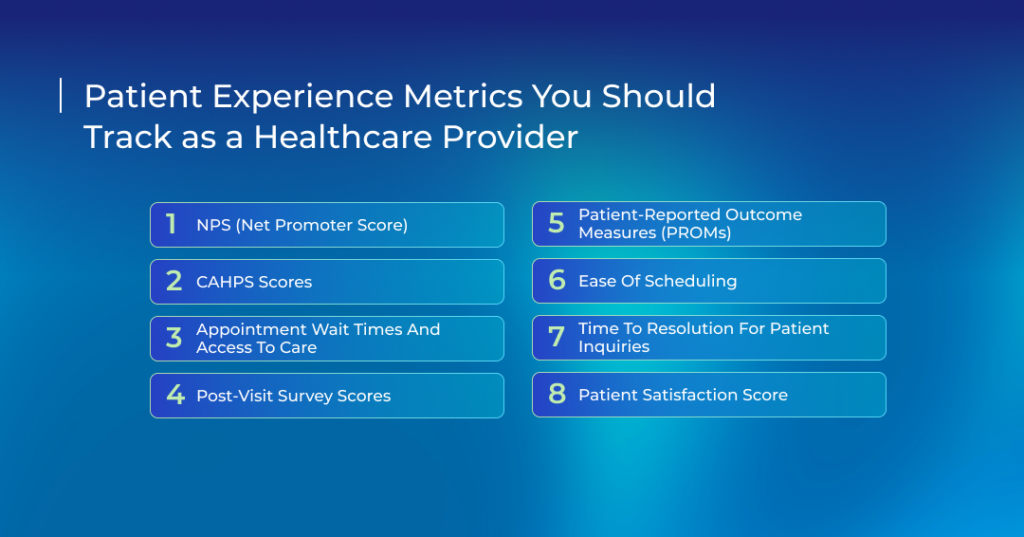
Patient Experience Metrics You Should Track as a Healthcare Provider
Perhaps you’ve changed your outreach or the way your staff handles appointments. Tracking the right metrics here is how you know whether patient experiences are improving or not.
They provide you with actionable data in real time while monitoring several aspects such as loyalty, satisfaction, and outcomes. Together, the following metrics will give you a clear picture of your patients’ journeys.
1. NPS (Net Promoter Score)
NPS asks patients one question: Would you recommend us? Their answer tells you if they trust you enough to put their name behind your healthcare organization. Patients who score you high come back. Patients who score you low tell their friends to stay away.
Why Track NPS
This patient satisfaction metric predicts loyalty better than most complex surveys. It contains only one question, so you can collect feedback at various touchpoints without bothering patients with long surveys.
NPS is an important metric for providers because you can quickly find and address unhappy patients. This ties with the fact that it’s more expensive to attract new patients than to retain existing ones.
How to Measure
Ask patients whether they will recommend you or not on a scale of 0 to 10. Those who give you a 9 or 10 are called Promoters, while scores below 6 are called Detractors. Subtract the percentage of the former from the latter to find your NPS.
2. CAHPS Scores
CAHPS surveys come straight from the federal government. They measure very specific areas of care, such as whether your staff are courteous and how easy it is to get an appointment. These questions are the same everywhere, so patients can compare your results to other providers.
Why Track CAHPS Scores
CAHPS scores shine a light on the care your patients receive. Higher scores mean you have a strong reputation in the community, and that patients trust you. In most cases, high scores also improve your reimbursements from insurance companies.
CAHPS data shows you exactly where you’re falling short. If patients say your doctors don’t explain things clearly, you know what to focus on.
How to Measure
There’s a CAHPS survey for clinics, another for hospitals, and another for health plans. Pick the one for your setting and use it to survey a random sample of recent patients.
You cannot change the questions, since they are standardized by the federal body. The results show both your raw numbers and how you rank compared to others.
3. Appointment Wait Times and Access to Care
This metric is pretty straightforward. It measures how long it takes your patients to get an appointment.
Why Track Wait Times
Patients expect to get care when they need it. They’ll likely find another doctor if your specialist isn’t available. This increases your no-show rates and hurts your reputation as a provider. The same goes for crowded waiting rooms.
How to Measure
Track your third open slot that can be booked by a patient in case they call today. Minus that from the date of the request. Measure this separately for new and existing patients, and for each specialty if you have more than one.
4. Post-Visit Survey Scores
These surveys go out right after an appointment. They ask patients specific questions about their visit.
Why Track Post-Visit Surveys
These patient satisfaction metrics catch problems while they’re fixable. If your front desk was rude to several patients on Monday, you get to fix that within the week. Monthly or quarterly reports are just too slow, and by then, the affected patients have already written you off.
How to Measure
Create a short survey (5-7 questions related to the visit) and send it to patients within 48 hours via text or email. Any longer and patients will likely forget important details. You can use any scale ranging from 1-5 or 0-10, but the latter gives more specific results.
5. Patient-Reported Outcome Measures (PROMs)
PROMs measure patient experiences a bit differently than other metrics. These questionnaires allow patients to report in their own words how they feel about their health—things only the patient can tell you.
Why Track PROMs
Clinical tests don’t tell the whole story. Sometimes, like in the case of chronic patients or those recovering from surgery, only the patients can tell whether they’re getting better or not.
For example, PROMs can show whether your arthritis patient can climb stairs again or whether your depression treatment is actually reducing symptoms.
How to Measure
There are standardized PROM tools for different patient groups. For example, the PHQ-9 measures depression, while the SF-36 measures quality of life. Have patients fill out these forms before and after treatment to see any positive change.
6. Ease of Scheduling
This metric focuses purely on how easy and fast it is for patients to book a visit. While other metrics might touch on scheduling as part of a broader experience, this one measures scheduling efficiency.
Why Track Ease of Scheduling
Patients who can’t book easily often go somewhere else. That’s revenue loss for providers that can start stacking up to reach millions annually.
Providers need to know how long their phone-based bookings are taking on average. Even those using online scheduling tools can use the data to further optimize their booking process. It leads to fewer no-shows and better patient retention.
How to Measure
There are several aspects to measuring your ease of scheduling. You can track how many patients successfully book appointments through phone calls versus self-schedulers. You can also track how many patients start but leave midway. Fewer than 30% means friction, and that your system needs work.
Additionally, a simple survey to ask patients about their scheduling experience makes a difference as well. How fast or easy was it? How many clicks or tries did it take?
7. Time to Resolution for Patient Inquiries
When patients call with questions, they want answers. They don’t want callbacks or to be transferred. The time to resolution measures how long it takes to solve a patient’s problem from the moment they make contact.
Why Track Resolution Times
Unresolved inquiries create frustration. A patient who calls three times about a prescription refill is having a bad experience, even if someone answered quickly each time. You need to know where these gaps lie to improve patient experiences, or else risk seeing them switch providers.
How to Measure
First-call resolution is the gold standard. It’s the percentage of resolved calls divided by total calls. Do note, though, that resolved here means the patient’s issue is completely handled without any need for follow-up.
8. Patient Satisfaction Score
This metric asks patients to rate their overall experience. It’s different from NPS, which focuses on loyalty, and CAHPS, which focuses on specific aspects. PSS focuses solely on overall satisfaction.
Why Track Patient Satisfaction
PSS gives you a quick pulse check on how you’re doing. High scores mean your patients are likely to follow their care plans and return for follow-ups. They are also likely to recommend you to others.
This metric also reveals problems fast. If your PSS drops suddenly, something has changed.
How to Measure
Send a short survey to patients using simple questions and a simple scale like 1-5 or 1-10. Then divide the total score patients gave you by the total number of responses.
Best Practices for Measuring and Improving Patient Satisfaction
Tracking patient experience metrics is only half the work. You need to act on what you learn.
Use automated surveys. They free your team from the burden of manual work while ensuring not a single patient slips through. Plus, they’re easy to scale across departments, no matter how many patients you serve.
Set up your systems to automatically send out surveys within 24-48 hours via text or email—the former nets higher response rates. If certain questions don’t give you useful insights, adjust them to gather clearer, more meaningful feedback.
Integrate feedback with your EHR. This lets your team see the patient’s survey data alongside their clinical record. Someone who scores you low on communication might have complex health issues that need more explanation time. EHR integration also tracks which providers get the best scores.
Train your staff on what matters to patients. Share your survey results with your team to celebrate wins and work on losses. The best training focuses on real scenarios from your own patient feedback. So, have your staff practice difficult conversations like explaining wait times or handling frustrated patients.
Act on feedback quickly. Running surveys is no good if you wait too long to act on them. You need to close the loop with patients who had bad experiences to ensure the same issues don’t affect future patients.
Use multiple feedback channels. Check online reviews and health forums to see what people are saying about you. Keep a close eye on your referrals and cancellation rates. Sometimes, your front desk workers and nurses hear complaints that never make it into surveys.
How TeleVox Helps Improve Patient Experience Metrics for Healthcare Organizations
When every call, reminder, and follow-up shapes how a patient feels about their care, you can’t leave their experience to chance. That’s where Televox’s suite of solutions comes in.
We help healthcare organizations track, measure, and improve patient experience in real time. Our multichannel platform connects every touchpoint via text, voice, live chat, and email, freeing your data silos to create a seamless flow of communication that feels personal and responsive.
With our conversational AI, your patients get answers, manage billing or prescription refills, and access intake forms instantly through self-service chat.
Televox also understands how every interaction tells a story. Insights360 gives you the full picture, showing what’s working, where friction exists, and how each engagement impacts satisfaction and outcomes.
If you’re ready to see how better connections drive better care, schedule a demo, and let’s start improving your patient experience metrics together.
Related Posts